How do I read a budget report?
Once you have finished configuring a budget, iBank automatically reads the transactions from your accounts, compares your income and expenses against your expectations, and presents the results in an easy-to-read report.
Using the report controls
Directly above the report, below the main toolbar, you will find a number of controls that allow you to interact with the budget report:

- Back/forward arrows: These are used to navigate back and forth through the report, similar to the back and forward arrows you use in a web browser. The report itself is interactive: clicking on the name of a category, for instance, will drill down to show you a more detailed report on that category. The back button in this case will return you to the main report.
- Parent/sub-category buttons: These buttons control how sub-categories are displayed on the report. If you choose to display parent categories, activity in sub-categories will be counted under their parents. You can click on a parent category to show detailed information about its sub-categories. If you choose to display sub-categories on the main report, each sub-category will appear as a separate line, and parent categories will only be displayed if they have activity that does not fall under any of their sub-categories.
- Action (gear) button: This button is used to edit the budget. If you are using envelope budgeting, it also contains commands for managing your envelopes.
-
Budget period controls: In the center of the bar you will see a label indicating the current budget period. To change it, click the label and choose another option: the choices shown reflect weekly, monthly, quarterly, and annual periods. To move backward and forward in time, click the up and down arrows, respectively, to the left of the label. The information shown on the report will update accordingly so that you can see how your budget was configured and how you performed during any budget period.
Any changes you make to your budget configuration in one period will apply to that period and into the future. iBank tracks each of the changes you make so that when you view a past budget period it will remember how your budget was configured at that point in time.
- Zoom control: Use the slider to zoom the budget in and out, or click the zoom button to automatically scale the report to fill the available space.
Interpreting the charts and tables
At the top of the report is the name of the budget, along with the start and end dates of the period you are currently viewing. Various charts and tables follow to help you analyze your budget performance:
Budget progress line chart:

This chart shows a line plot of your expected and actual expenses during the budget period. The dashed line represents your expected expenses, while the solid line represents your actual spending. Totals for each are displayed to the right, along with the difference between them. This difference is your total surplus or deficit for the budget period. A vertical line may appear on the chart to indicate the current date.
Summary table:

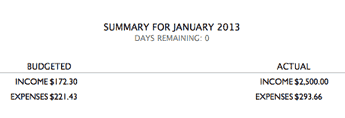
Below the line chart is a table summarizing your budget performance for the period you are viewing. The title of this section indicates the budget period and how many days remain before the period is over. Beneath that are two columns, one showing your total budgeted income and expenses, and the other showing your total actual income and expenses (including expected and unexpected amounts). If you use multiple currencies, these amounts are automatically converted to the budget's default currency using the latest exchange rates.
To copy the figures from this table to Numbers, Excel, or another spreadsheet program, simply drag & drop the table from iBank into your program of choice. If you drag the table to the Desktop, iBank will create a tab-delimited text clipping that can be dropped into a spreadsheet program or text editor for further analysis.
Table of expenses & income:

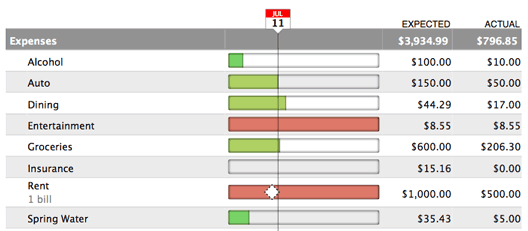
Below the summary information is a table detailing your expenses and income during the budget period. It includes the following columns:
- Expenses/Income: The name of the category (or account, in the case of a budgeted transfer).
- Progress: A colored progress bar that illustrates the percentage of actual vs. expected spending or earning in the category during the budget period. For income, red indicates that you earned much less than you expected, yellow and orange indicate that you earned somewhat less than you expected, and green indicates that you earned as much or more than what you expected. For expenses, green indicates that you are below or at your expected spending, yellow and orange indicate that you are slightly over what you expected, and red indicates that you spent much more than you expected. Performance for unscheduled items is relative to the current date, so that you can tell whether your earning and spending are on track throughout the month.
Scheduled income and expenses appear as diamonds placed on the bar according to their due dates. Empty diamonds have not been paid yet. For income, red diamonds indicate underpayment and green diamonds indicate on-target or overpayment. For expenses, green diamonds indicate underpayment or on-target and red diamonds indicate overpayment. A vertical line in this column indicates today's date. - Expected: The amount you expected to spend or earn in the category during the budget period, including scheduled and unscheduled items.
- Actual: The amount you actually earned or spent in the category during the budget period. If you use multiple currencies, this amount is automatically converted to the budget's default currency using the latest exchange rates.
- Envelope: The amount of cash currently saved for the category (only appears when envelope budgeting is enabled).
The category rows that follow are grouped into four sections: Expenses, Unexpected Expenses, Income, and Unexpected Income. Expenses and Income show the categories you planned to include in your budget; the Unexpected sections show income and expenses you did not plan for, including uncategorized transactions. These can be useful for refining your budget and making sure it includes all of your actual spending.
Click on any category to "drill down" and view more information about that category. If the category contains sub-categories, the next report will show an income/expense table for each of those sub-categories. If the category has no sub-categories, the next report will show the budgeted and actual totals for that category, any scheduled income or expenses set up in your budget for that category, and a list of transactions that make up the total shown for that category. Click a scheduled budget item to view its associated scheduled transaction in a new window; click a transaction to view that transaction in a new window. You may edit these transactions as needed, and when you save your changes, the report will be updated automatically. Use the arrow buttons above the top left corner of the report to navigate back and forth as you drill down into the report details.
To copy the figures from this table to Numbers, Excel, or another spreadsheet program, simply drag & drop the table from iBank into your program of choice. If you drag the table to the Desktop, iBank will create a tab-delimited text clipping that can be dropped into a spreadsheet program or text editor for further analysis.
Top expected expenses & income pie charts:

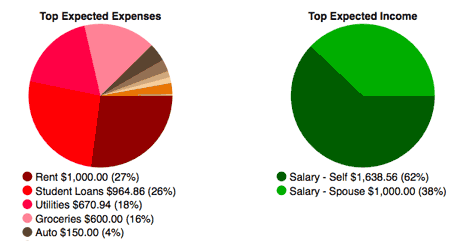
These are pie charts depicting your planned expenses and income for the budget period. Each pie slice represents the total value of a particular category or transfers associated with a particular account, and the slices are drawn proportionally so that you can see which items comprise a larger portion of your budget. This can assist you with prioritizing various categories when planning your budget.
Below each chart is a key that shows which colors correspond to which categories/accounts and the amount you expect to spend or earn during the budget period. Mouse over any category or account name to highlight the corresponding slice in the pie chart above. Click on any pie slice to "drill down" and see more detail. Use the arrow buttons above the report to navigate back and forth as you drill down into the report details.
Print or save a copy of the report
The main report and any of the detailed reports that you can drill down to can be printed simply by choosing File > Print and clicking the "Print" button. The paper size used for the printout can be changed by choosing File > Page Setup and selecting a different setting, but the orientation is restricted to portrait mode (landscape is not permitted).
To save a copy of a report as a PDF file, choose File > Print, then click the "PDF" button and choose "Save As PDF." Enter a name for the new file, choose where you want to save it, and click "Save." You will then have a copy of the report that you can view and print using the Preview application or any standard PDF reader.